AlwaysOnline Header

AlwaysOnline Header Component

Scroll down or resize the browser to test responsive behavior. Hover over the nav items to open mega menus.

DATA & INSIGHTS

Complete Visibility at Every Level

AlwaysOnline doesn't just deliver curriculum — it delivers insight. A four-tier dashboard ecosystem ensures every stakeholder sees exactly what they need, when they need it, to help students succeed.

📊 Real-Time Data
🎯 Proactive Intervention
💡 Instant Insights
Explore All Dashboards

FOUR TIERS OF VISIBILITY

Every Stakeholder Sees What They Need

From individual students tracking their own progress to leadership asking complex questions in plain English — data flows through every level of your school.

🎓

Student

Personal dashboard with pacing guides

Self-Awareness & Ownership

👩‍🏫

Teacher

Class-wide monitoring, identifying students at risk

Proactive Intervention

🏫

Administrator

School-wide trends and all data

Strategic Decision-Making

⚡

Leadership

QuickSight Q — ask anything

Instant Insights

🎓

TIER 1

Student Dashboard

Students track their own progress through a personal dashboard with built-in pacing guides. Self-paced doesn't mean self-guessing — students always know exactly where they stand and where they need to be.

Zip Pacing Coach

Personalized Pacing Guide — Powered by Zip

Zip, our AI pacing coach, works with each student to set a target completion date and builds a personalized day-by-day schedule to get there. If a student falls behind, Zip sends a nudge and adjusts the plan — so small slip-ups never become big problems.

✓

Assignment Tracking

Clear view of completed, pending, and upcoming assignments with due dates

✓

Grade Summary

Running grade calculations with performance trends across each course

✓

AI Tutor Access

One-click access to Sage AI Tutor for 24/7 personalized learning support
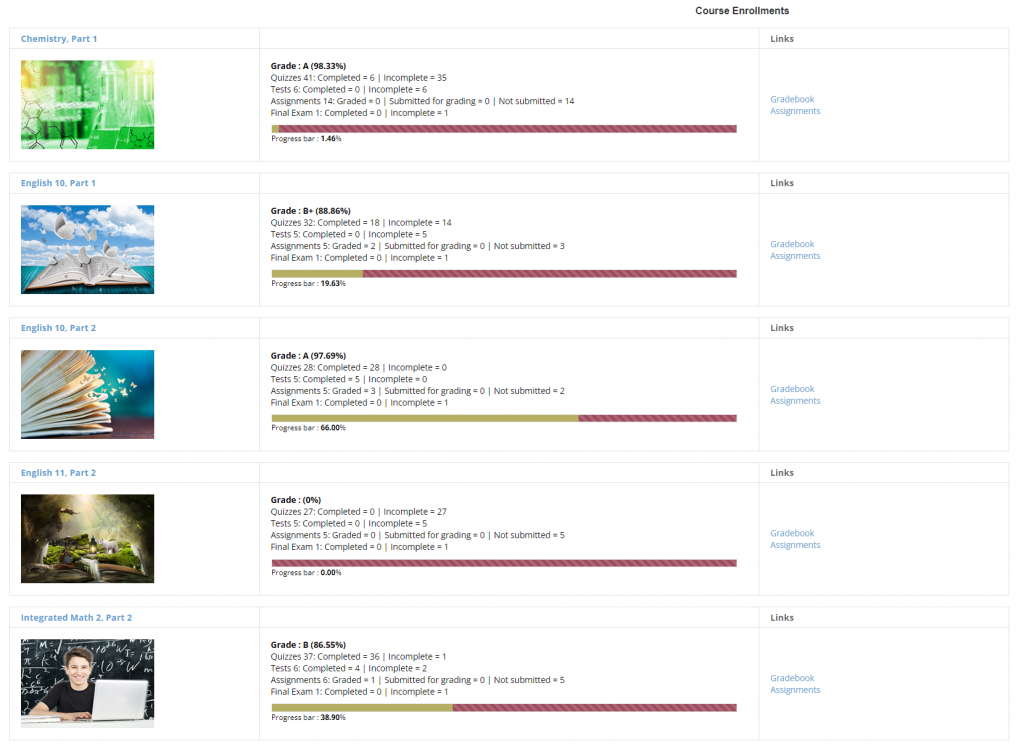
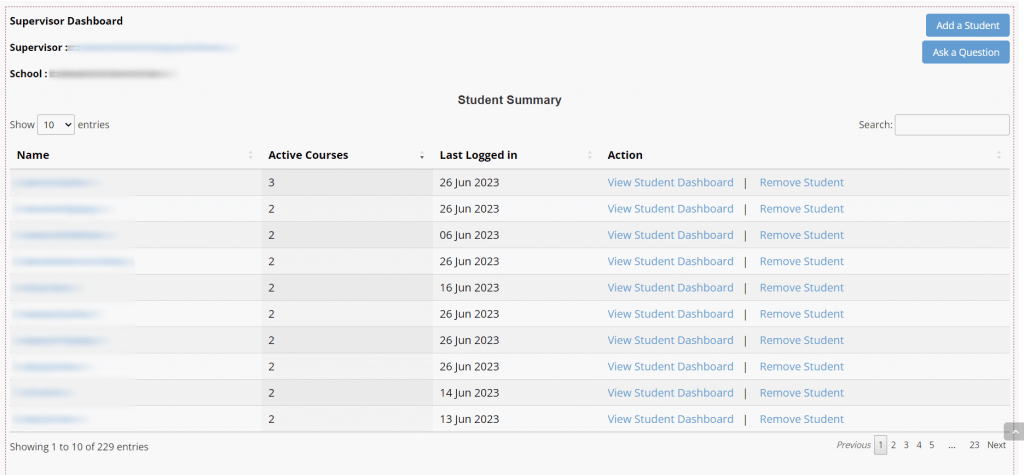
AlwaysOnline Student Dashboard
AlwaysOnline Teacher Dashboard

▶ VIDEO WALKTHROUGH — Navigating the Student Dashboard

👩‍🏫

TIER 2

Teacher Dashboard

Teachers get a clear, at-a-glance summary of their entire class — then can drill down into any individual student's dashboard for a deeper look at progress, activity, and performance.

✓

Class-Wide Summary View

See a high-level snapshot of all students in one place — who's active, where they are in the course, and how they're doing overall

✓

Per-Student Drill-Down

Click any student to open their individual dashboard and review their activity, progress, and grades in detail

✓

Designed for Teacher Workflow

The dashboard is built around how teachers actually work — quick overview first, detail on demand

"Data doesn't replace teacher judgment — it informs it. Teachers still decide how to help; the dashboard shows them where to look."

🏫

TIER 3

Administrator Dashboard

Administrators see the big picture — every course, every teacher, every student trend. Powered by AWS QuickSight and QuickSuite, the data you need for board presentations, accreditation reports, and day-to-day decisions is always current and accessible.

Drill down from the school-wide view into any teacher's dashboard — then further into any individual student's experience.

✓

School-Wide Progress

Comprehensive view of all programs, courses, and student outcomes across the school via QuickSight analytics

✓

Drill-Down Navigation

Click into any teacher's dashboard to review their classes and performance, then drill further into any individual student's dashboard

✓

At-Risk Student Identification

School-wide early warning system to catch struggling students across all courses before they fall behind

✓

Compliance & Reporting

Ready-to-use data for board presentations, accreditation reviews, and district reporting

School-Wide Overview

Spring 2026

Active Students

342

Completion Rate

91%

Active Courses

24

At-Risk Students

12

School › Teacher Dashboard › Student Dashboard

Top Performing Courses

AP English

96%

World History

94%

Chemistry

89%

TIER 4 — BREAKTHROUGH ANALYTICS

Ask Questions in Plain English. Get Instant Answers.

AWS QuickSight Q transforms complex data into actionable insights — accessible to everyone through natural language queries. No technical expertise required. No IT involvement. No waiting for reports.

EXAMPLE QUERIES YOU CAN ASK

💬

"Which students are at risk of not completing on time?"

💬

"How do completion rates compare between semesters?"

💬

"Which courses have the highest failure rates?"

💬

"Show students active last month who haven't logged in this week"

💬

"Compare student performance across implementation models"

Powered by AWS QuickSight Q

Why This Changes Everything

No competitor in educational technology offers natural language querying at this level. This isn't an incremental improvement — it's a fundamental transformation in how schools use data.

TRADITIONAL ANALYTICS

✗ Technical staff for queries

✗ Days or weeks for reports

✗ IT involvement required

✗ Expensive BI tools

QUICKSIGHT Q

✓ Type a question

✓ Answers in seconds

✓ No technical skills needed

✓ Included with platform

Learn more about QuickSight Q Analytics →

THE COMPLETE PICTURE

Proactive, Not Reactive Education

When every stakeholder has visibility at their level, education transforms. Problems are caught early, decisions are evidence-based, and no student slips through the cracks.

🎓
Student Falls Behind

Pacing guide shows student they're behind schedule — student self-corrects or seeks help

👩‍🏫
Teacher Gets Alerted

Dashboard flags the student immediately — teacher intervenes with targeted support

🏫
Admin Sees Trends

If patterns emerge across classrooms, administrators allocate resources where needed

⚡
Leadership Asks Why

QuickSight Q reveals systemic patterns — leadership makes data-driven strategic decisions

Students who start falling behind are identified immediately — not at mid-term

Teachers intervene early — when small adjustments prevent major problems

Administrators allocate resources based on evidence — not assumptions

Leadership asks questions and gets instant answers — without waiting for reports